

The extraordinary league of league tables
Ever looked at a league table and thought, “I support the team, but what on earth does all of this mean?” Statistician and lifelong ice hockey fan Gemma Selby is here to decode the acronyms, explain the points system and make sense of the standings.
The league table is one of those things you’ll see on your team’s website or social media, but perhaps not always pay a great deal of attention to (until you’re hitting the final games of the season and praying the points go up enough to make the playoffs).
It’s not as interesting to look at as game footage, and there’s an excessive number of acronyms, so you’re absolutely forgiven if you want to ignore it for the goals and the glove drops. But, if you want to understand your GP vs your GF (spoilers; no doctors or girlfriends) then you’ve come to the right place!
League table structure and how points work
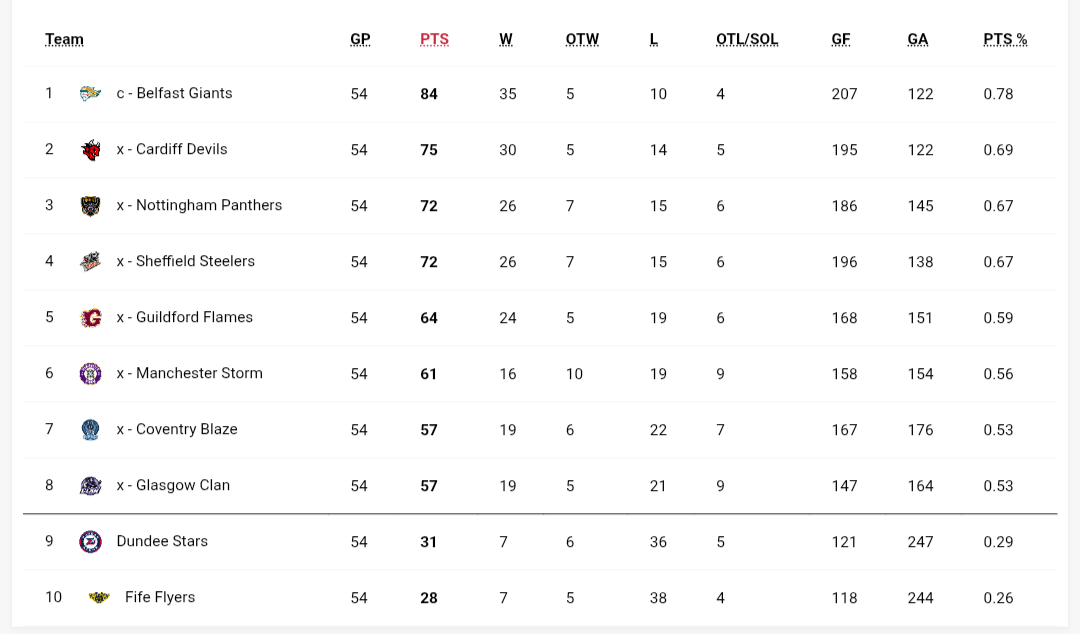
Above is one example of a league table, which you might be familiar with if you’re following teams in the EIHL. Most league tables tend to include similar terms and acronyms, although bigger leagues like the NHL include a few extra statistics for the die-hard numbers people. You’ll usually see the following:
- GP (stands for Games Played) - a nice self-explanatory one to start! Each league will have a different number of games each team is expected to play per season, for example the EIHL expects teams to play 54 games per season.
- W (stands for Wins) - this refers to wins specifically in regulation time, i.e. the three 20 minute periods of the game. Anything outside of this goes to overtime or shootout (OT). A win in regulation time will earn a team 2 points (this is true for most UK/American leagues but there are some European leagues where a regulation time win will earn a team 3 points).
- L (stands for Losses) - like above, this refers to losses specifically in regulation time. A loss in regulation time will earn a team 0 points.
- OT (stands for Overtime) - this is where it gets a bit funky. Some league tables will say OTW (Overtime Wins) and OTL (Overtime Losses), and some will just say OT and refer to wins or losses! Usually if you hover over the column in the table though, it’ll tell you which it’s referring to. A win in overtime will earn a team 2 points, but even if a team loses in overtime, they’ll still earn 1 point.
- PTS (stands for Points) - this is the combination of any points from W, L and OT. It’s the most important statistic in the table, as it’s what a team’s overall position in the league is based on; it decides the winners and who gets to go to the playoffs.
- GF (stands for Goals For) - the total number of goals the team has scored.
- GA (stands for Goals Against) - the number of goals that has been scored against the team.
- PTS% (stands for Points Percentage) - this one is slightly less obvious. It essentially means the percentage of the maximum possible points that a team’s earned. An EIHL team plays 54 games.– so if they won every game they’d score 2 points per game and have the maximum possible number of points, 108. The Belfast Giants earned 84 points last season, making their PTS% 78 (84/108).
- GD or DIFF (stands for Goal Difference) - not used across all tables, but the NHL uses this to show the difference between GF and GA. This is usually calculated as GF minus GA. The more positive the number, the stronger the team is at scoring and defending. The more negative the number, the fewer goals they’re scoring and the more they’re conceding.
- STRK (stands for streak) - this relates to whether the team is on a winning or losing streak, and tends to be a letter followed by a number, such as W3, or L5 (indicating that the team has won their last 3 games, or lost their last 5 respectively).
The key stuff
Of course, the most important stat is points (PTS), because at the end of the day, that’s what decides where teams rank in the standingsHowever, if you’re looking at the table during the season, it’s important to also keep an eye on the games played (GP).
Teams with fewer games played have more upcoming opportunities to boost their points count, so although they currently have lower points , it might not be time to worry just yet! PTS% can be useful in this scenario as well as it gives an idea of how many of the possible points (based on number of games played) a team has earned and therefore how well they’ve performed in the games so far.
Throughout the season, it’s probably also worthwhile keeping an eye on the DIFF/GD (or GF and GA in combination if your table doesn’t have DIFF/GD). It’s possible for a team to have a really high GF number, which makes it look like they’re doing well and scoring lots of goals, but they might still be losing a lot of games and end up lower in the standings if their GA number is high. Essentially, the higher the GF and the lower the GA, the better a team is performing (or if you’re looking at DIFF/GD, the more positive the number is).
Now what?
So that’s the regular season table and points system explained. Once the regular season wraps up, most leagues take the top teams into the playoffs – aka the part where the joy, stress and heartbreak really kick in.
It’s pretty rare for teams to be tied at the bottom of the standings, but if it happens and there needs to be a way to decide who sneaks into the playoffs, leagues usually apply tie-breaker criteria. That might be things like most regulation wins, fewest losses, and so on – although the exact criteria, and the order they’re used in, can vary from league to league.
That’s the basic regular season picture up to playoffs. The fun part? Once playoffs begin, all of that basically goes out the window, because teams start again with a blank slate. I’ll get into how playoffs work in more detail another time, but hopefully this has given you a helpful intro to the stats and standings side of the game.